Quick answer
Website speed optimization means making pages load and respond fast on real phones. In Pakistan, where the national 4G average was 18.9 Mbps in Q2 2026, aim for Google's Core Web Vitals targets: LCP under 2.5 seconds, INP under 200 ms and CLS under 0.1. Fix images, caching, hosting and third-party scripts first.
Key takeaways
- Most Pakistani visitors browse on mobile data: PTA and Opensignal measured a national 4G average of 18.9 Mbps in Q2 2026, and much lower on some networks.
- Google's Core Web Vitals targets are LCP 2.5 s or less, INP 200 ms or less and CLS 0.1 or less, measured at the 75th percentile of real visits.
- PageSpeed Insights shows field data from real Chrome users over 28 days plus a Lighthouse lab test; fix problems with the lab data, judge success with the field data.
- Images, caching with a CDN, server response time and third-party scripts such as chat widgets and pixels cause most slow pages.
- Re-test after every change and give field data four weeks to catch up.
Why does website speed optimization matter so much in Pakistan?
Website speed optimization matters in Pakistan because most of your visitors are on mobile data, and mobile data here is still slower and less steady than in many markets you copy designs from. A page that feels fine on office Wi-Fi in Lahore can take many seconds on a mid-range phone on 4G in Hyderabad.
The numbers, as of November 2026:
- Pakistan had about 117 million internet users (45.6% of the population) and 194 million cellular connections at the end of 2025 (DataReportal, Digital 2026 Pakistan).
- Ookla's median mobile download speed for Pakistan was 24.32 Mbps, up 24.1% in the year to August 2025, while the median fixed broadband speed was only 16.28 Mbps (same source).
- In the PTA's Mobile Network Experience report for Q2 2026, with data collected by Opensignal, the national 4G average download speed was 18.9 Mbps, rising to 31.3 Mbps on high-end phones. Average speeds by operator ranged from 18.55 Mbps (Zong) down to 7.5 Mbps (Telenor) (ProPakistani). The national video experience score also fell from 44.97 to 37.53 out of 100 (Express Tribune).
Two sources, two different averages: Ookla and Opensignal measure in different ways, so treat them as a range, not a single truth. Either way, a large share of your customers load your site on a connection far slower than your developer's.
Speed is also money. In a web.dev case study, Vodafone improved its Largest Contentful Paint by 31% and saw 8% more sales in an A/B test (web.dev). Your results will differ, but the direction is consistent: slower pages lose people before they see your offer, and if you pay for ads, you pay for those lost clicks too.
What are Core Web Vitals and what scores should you aim for?
Core Web Vitals are three Google metrics that measure how a page feels to a real visitor: how fast the main content appears, how quickly the page responds to taps, and whether things jump around. Google recommends checking them at the 75th percentile of page loads, on mobile and desktop separately.
- LCP (Largest Contentful Paint): the time until the biggest image or text block on screen has loaded. Good is 2.5 seconds or less; poor is over 4 seconds.
- INP (Interaction to Next Paint): how long the page takes to visibly react after a tap, click or key press. Good is 200 milliseconds or less; poor is over 500 ms. INP replaced the older First Input Delay metric as a Core Web Vital in 2024.
- CLS (Cumulative Layout Shift): a score for how much content moves around while loading, such as a button jumping down when a banner appears. Good is 0.1 or less; poor is over 0.25.
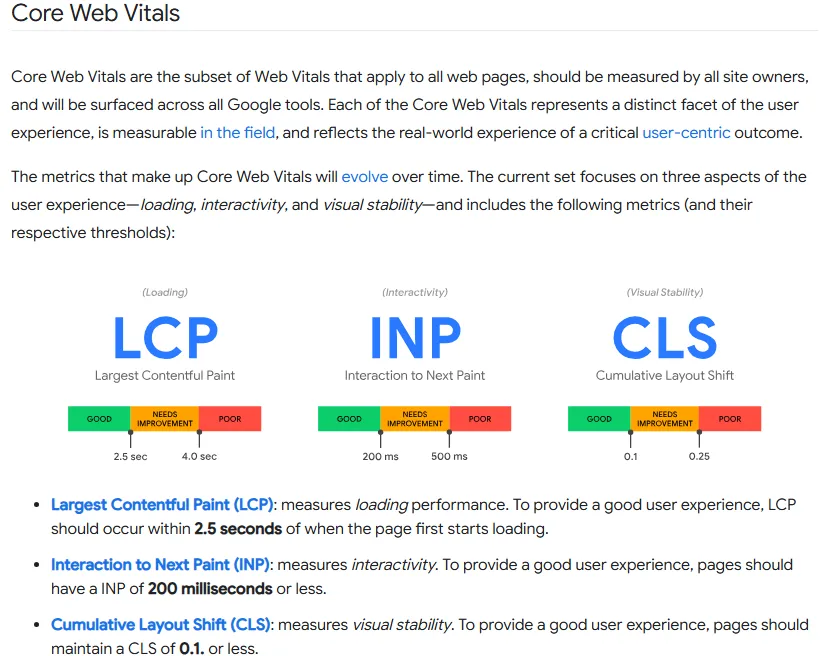
"75th percentile" means three out of four visits must hit the target. A fast experience for you on Wi-Fi does not count if a quarter of your visitors on slower networks wait much longer.
How do you run a website speed test the right way?
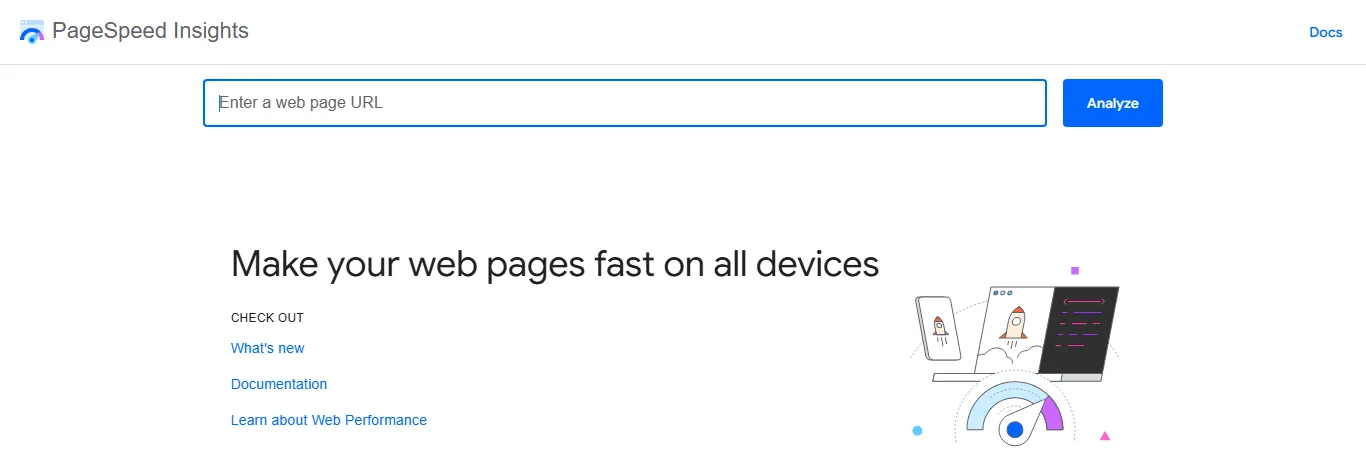
Use Google's free PageSpeed Insights as your main website speed checker, and Lighthouse in Chrome for deeper debugging. Test your most important pages: home page, top product or service page, and the landing page your ads point to.
Field data versus lab data
PageSpeed Insights shows two kinds of results, and mixing them up causes most confusion:
- Field data ("Discover what your real users are experiencing") comes from the Chrome User Experience Report (CrUX): real Chrome users visiting your page over the previous 28 days. This is what Google uses to judge Core Web Vitals. Small or new sites may not have enough visits to show page-level field data, so PSI falls back to the whole site, or shows nothing.
- Lab data ("Diagnose performance issues") is a single Lighthouse test on Google's servers, simulating a mid-tier phone on a slowed-down mobile network. It changes from run to run, but it tells you why a page is slow.
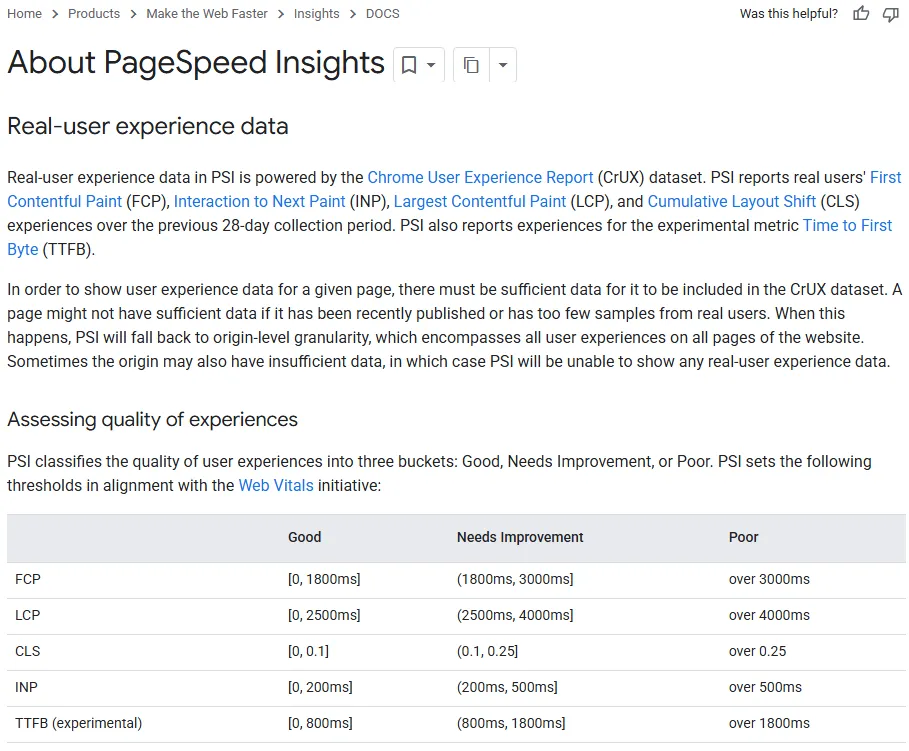
The rule we follow: fix with lab data, judge with field data. The Lighthouse performance score (0 to 100, where 90 or above is good) is a useful guide, but Google Search uses the field Core Web Vitals, not the lab score.
How do you read a Lighthouse report?
A Lighthouse report gives you a score, five lab metrics and a list of "Insights" and "Diagnostics" sorted by estimated savings. Start at the top of the red items and work down.
To show what this looks like, we ran Lighthouse 12 from the command line against a local development copy of our own site on 9 November 2026.
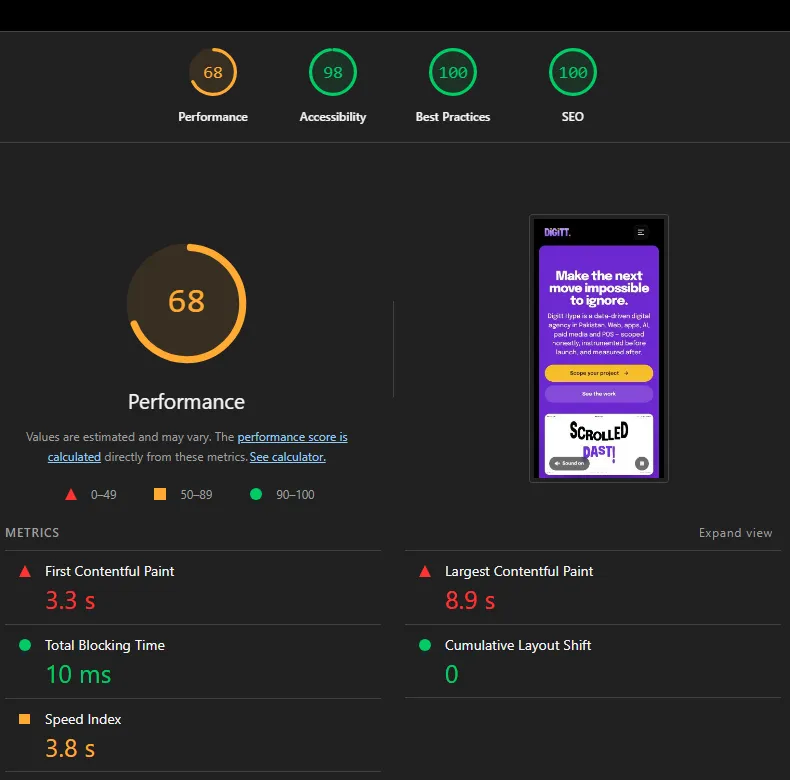
Look at the pattern: layout stability (CLS 0) and blocking time (10 ms) were fine, but the main content took far too long to appear. The report then tells you why.
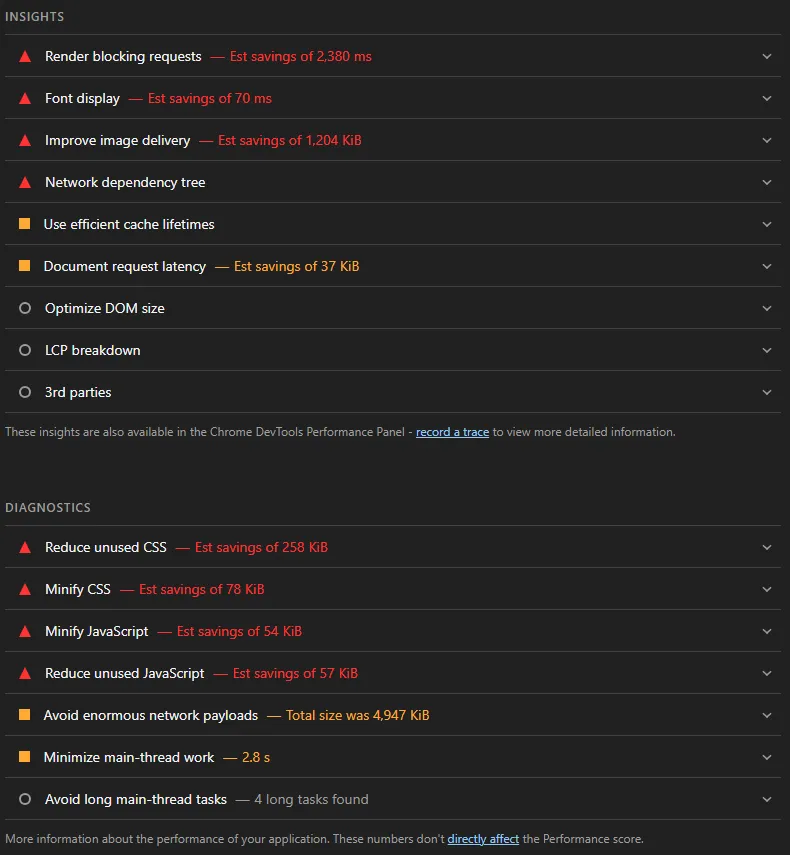
This is typical of what we see on Pakistani business sites: heavy images, render-blocking CSS and JavaScript, short cache lifetimes and a pile of third-party scripts. The steps below deal with each.
Website speed optimization: the step-by-step fix
Work through these steps in order. The early ones usually give the biggest gains for the least effort.
- Record a baseline. Run PageSpeed Insights on your three key pages and save the results (the share link or a screenshot). Note field LCP, INP and CLS if shown, plus the lab score. Done looks like: a simple sheet with today's numbers. Common mistake: testing only the home page.
- Fix your images first. Convert photos to WebP or AVIF, modern formats that are much smaller than JPEG and PNG; Google says lossy WebP is 25 to 34% smaller than a comparable JPEG (Google WebP). Resize each image to the largest size it is shown at; a 4,000-pixel phone photo in a 400-pixel box wastes data. Use
srcsetandsizesso phones get smaller files. Addloading="lazy"to images below the fold, but never to the main hero image; give that onefetchpriority="high". Always setwidthandheightto stop layout shifts. Done looks like: "Improve image delivery" is gone or small in Lighthouse. - Turn on caching and a CDN. Caching means the browser or server keeps a copy so it does not rebuild or re-download it each time. A CDN (content delivery network) stores copies of your files on servers close to your visitors. Cloudflare, for example, lists data centres in Karachi, Lahore and Islamabad on its network map, and its free plan covers basic CDN caching. Set long cache lifetimes for images, CSS, JS and fonts that use versioned file names. Done looks like: "Use efficient cache lifetimes" passes. Common mistake: caching pages that show a cart or login, which can show one customer's data to another; exclude them.
- Choose hosting close to your visitors. TTFB (Time to First Byte) is how long the server takes to start replying; PSI rates it good at 800 ms or less. If your customers are in Pakistan and your server is on another continent, every request travels further. Compare hosts by testing TTFB from Pakistan, not by their marketing. Cheap shared hosting with many sites on one server is a common cause of slow TTFB; upgrading the plan or the PHP version often helps more than any plugin.
- Remove render-blocking CSS and JavaScript. Files in the page head that must load before anything shows are render-blocking. Add
deferto scripts that are not needed for the first screen, remove CSS and JS the page does not use, and minify the rest. Done looks like: a much smaller "Render blocking requests" saving. - Load fonts sensibly. Use one or two font families and only the weights you need. Self-host them or use a fast font service, add
font-display: swapso text shows immediately, and preload the main font file. If you show Urdu text, test the Urdu font's file size; Nastaliq fonts can be large. - Audit third-party scripts. Chat widgets, Meta Pixel, TikTok Pixel, heatmaps, review badges and sliders each add requests and JavaScript, which hurts INP. List every script in Google Tag Manager and on the page. Remove what nobody uses, and load chat widgets only after the visitor scrolls or taps. A simple WhatsApp link button costs almost nothing compared with a full chat widget.
- Apply the WordPress-specific fixes. If your site runs on WordPress: delete inactive plugins and themes; replace heavy all-in-one plugins with lighter ones; use a page caching plugin (or your host's built-in cache); make sure the server runs a currently supported PHP version; turn on an image optimisation plugin that serves WebP or AVIF; avoid loading page-builder scripts on pages that do not use them. Test after each change, because caching and optimisation plugins can conflict.
- Fix layout shifts and slow taps. For CLS, set image and video dimensions, reserve space for banners and embeds, and avoid inserting content above what the visitor is reading. For INP, cut JavaScript work: fewer scripts, smaller bundles, and break long tasks into smaller ones. Done looks like: CLS 0.1 or less and INP 200 ms or less in field data.
- Re-test and monitor. Re-run PageSpeed Insights after each step and compare with your baseline. Then watch the Core Web Vitals report in Google Search Console, which groups your URLs into Good, Needs improvement and Poor. Field data covers 28 days, so allow about four weeks before judging.
Which fixes improve which Core Web Vitals?
Use this table to decide what to do first. Pick the metric that is failing in your field data, then start with the low-effort fixes in that row.
| Fix | Mainly improves | Effort | Notes |
|---|---|---|---|
| Compress and resize images, WebP/AVIF | LCP, page weight | Low | Biggest win on most small-business sites |
| Do not lazy-load the hero image; add fetchpriority | LCP | Low | One-line change in the template |
| CDN and cache headers | LCP, TTFB on repeat visits | Low to medium | Exclude cart, checkout and account pages |
| Better hosting or server location | TTFB, LCP | Medium | Test TTFB from Pakistan before switching |
| Defer or remove scripts | LCP, INP | Medium | Check that tracking still fires after changes |
| Fewer fonts, font-display swap | LCP, CLS | Low | Watch Urdu font file sizes |
| Set image and embed dimensions | CLS | Low | Applies to ads, maps and video embeds too |
| Remove or delay chat widgets and pixels | INP, LCP | Low to medium | Keep a light WhatsApp link instead |
Website speed mistakes to avoid
- Chasing a 100 score. The goal is passing Core Web Vitals for real visitors, not a perfect lab number.
- Testing on your own Wi-Fi. Test on a mid-range Android phone on mobile data as well, ideally on more than one network.
- Installing three speed plugins at once. They overlap, conflict and sometimes make things slower. Change one thing, then re-test.
- Lazy-loading everything. Lazy-loading the main image delays LCP.
- Breaking tracking while "optimising". Deferring or delaying scripts can stop your Meta Pixel or GA4 events. Check your events after each change.
- Forgetting the landing pages your ads use. Paid traffic often goes to pages nobody tests. See our Google Ads setup guide for why this costs you twice.
- Buying a cheap build and paying later. If you are comparing quotes for website development in Pakistan, ask each agency to show field Core Web Vitals for sites they built. Our post on the real cost of a custom website in Pakistan covers what to ask.
Your 30-day website speed checklist
Copy this into your task list and tick it off:
- Day 1: run PageSpeed Insights on your three key pages, mobile and desktop; save the baseline.
- Days 2 to 5: compress, resize and convert images; fix the hero image loading; add width and height to every image.
- Days 6 to 10: set up a CDN and cache headers; exclude cart, checkout and account pages; re-test.
- Days 11 to 15: list every third-party script; remove unused ones; delay chat widgets; confirm GA4 and pixels still fire.
- Days 16 to 20: defer non-critical JavaScript, trim fonts, and on WordPress remove unused plugins and update PHP with your host.
- Days 21 to 25: check TTFB; if it is poor, talk to your host or test a better plan or location.
- Day 30: re-run PageSpeed Insights, open the Search Console Core Web Vitals report, and compare with Day 1.
Quick win for clinics and restaurants
Clinic and restaurant sites often load a full-screen slider, a Google Map embed and a chat widget on the home page. Replace the slider with one compressed image, load the map only on the contact page, and swap the chat widget for a WhatsApp button. Re-test: this alone often removes several of the red items in Lighthouse.
How Digitt Hype can help
Digitt Hype builds and rescues websites with speed checked before launch: compressed images, caching and CDN, lean scripts, and tracking that still works afterwards. We test on mobile data, not just office Wi-Fi, and report field Core Web Vitals. See our web development service and our work for online stores, estimate a build with the website cost calculator, or contact us for a speed review.
Frequently asked questions
What is a good website speed test score?
In PageSpeed Insights a Lighthouse performance score of 90 to 100 is rated good, 50 to 89 needs improvement and below 50 is poor. More important is the field data: your page passes Core Web Vitals when LCP is 2.5 seconds or less, INP is 200 milliseconds or less and CLS is 0.1 or less for 75% of visits.
Which website speed checker should I use?
Start with Google PageSpeed Insights because it shows both real-user field data and a Lighthouse lab test. Use Lighthouse inside Chrome DevTools for deeper debugging, and the Core Web Vitals report in Google Search Console to track all your pages over time. Test on a real mid-range phone on mobile data too.
Why is my PageSpeed score different every time I test?
The lab score comes from a single simulated test, so network conditions, server load and third-party scripts make it vary between runs. Run it three times and look at the middle result. Field data in PageSpeed Insights is steadier because it averages real Chrome visits over the previous 28 days.
Does website speed affect Google rankings?
Google uses Core Web Vitals as part of its page experience signals, but relevance and content quality matter much more. Treat speed as a tie-breaker for rankings and a big factor for conversions: a slow page loses visitors and ad clicks before they see your offer, whatever its ranking.
Is Cloudflare enough to make my website fast?
A CDN such as Cloudflare helps by serving cached files from servers closer to visitors; Cloudflare lists locations in Karachi, Lahore and Islamabad. It does not fix oversized images, heavy scripts or a slow server for uncached pages. Use it together with image, script and hosting fixes.
How long does it take to see Core Web Vitals improve?
Lab results change as soon as you deploy a fix. Field data in PageSpeed Insights and Search Console covers the previous 28 days of real visits, so expect it to move gradually over about four weeks. Search Console also needs enough traffic per page group before it shows data.
Sources 9
- DataReportal: Digital 2026 Pakistan
- ProPakistani: New PTA report reveals Pakistan's fastest mobile network (Q2 2026)
- Express Tribune: Faster phones, worse video on 4G
- web.dev: Web Vitals
- Google for Developers: About PageSpeed Insights
- web.dev: Vodafone case study
- Google for Developers: WebP
- Cloudflare: Global network
- Lighthouse on GitHub
Numbers not matching your dashboard?
That gap is worth an hour of someone’s time. Tell us what you see and we will look at it with you.